
Internet Pornography statistics become outdated very quickly, especially in the Internet environment where numbers change daily. These statistics have been derived from a number of different reputable sources including the sources sited at the bottom of the page.
See the latest in Internet Filtering, Internet Control and Internet Reporting.
 |
Pornography Time Statistics |
| Every second – $3,075.64 is being spent on pornography | |
| Every second – 28,258 Internet users are viewing pornography | |
| Every second – 372 Internet users are typing adult search terms into search engines | |
| Every 39 minutes: a new pornographic video is being created in the United States |
| 2006 Worldwide Pornography Revenues | ||||
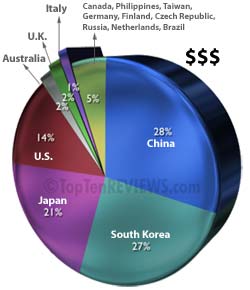 |
Country | Revenue (Billions) |
Per Capita | Notes |
| China | $27.40 | $27.41 | 1 | |
| South Korea | $25.73 | $526.76 | ||
| Japan | $19.98 | $156.75 | ||
| US | $13.33 | $44.67 | ||
| Australia | $2.00 | $98.70 | ||
| UK | $1.97 | $31.84 | ||
| Italy | $1.40 | $24.08 | ||
| Canada | $1.00 | $30.21 | ||
| Philippines | $1.00 | $11.18 | ||
| Taiwan | $1.00 | $43.41 | 1 | |
| Germany | $.64 | $7.77 | 1 | |
| Finland | $.60 | $114.70 | 1 | |
| Czech Republic | $.46 | $44.94 | 1 | |
| Russia | $.25 | $1.76 | 1 | |
| Netherlands | $.20 | $12.13 | ||
| Brazil | $.10 | $53.17 | 1 | |
| Other 212 | Unavailable | 2 | ||
| $97.06 Billion | ||||
| Notes 1=Incomplete, 2=Unavailable data | ||||
| The pornography industry is larger than the revenues of the top technology companies combined: Microsoft, Google, Amazon, eBay, Yahoo!, Apple, Netflix and EarthLink | ||||
| 2006 and 2005 Pornography United States Industry Revenue Statistics | |||
 |
2006 (Billions) |
2005 (Billions) |
|
| Video Sales & Rentals | $3.62 | $4.28 | |
| Internet | $2.84 | $2.50 | |
| Cable / PPV / In-Room / Mobile / Phone Sex | $2.19 | $1.34 | |
| Exotic Dance Clubs | $2.00 | $2.00 | |
| Novelties | $1.73 | $1.50 | |
| Magazines | $.95 | $1.00 | |
| $13.33 | $12.62 | ||
| US porn revenue exceeds the combined revenues of ABC, CBS, and NBC | |||
| 2006 Top Adult Search Requests | Demographics | |||||||||||
| Search Term |
2006 Search Requests | 2006 % Change | 2005 % Change | Web Pages Containing Keyword (Millions) | Male | Female | <18 | 18-24 | 25-34 | 35-49 | 50+ | |
| 75,608,612 | 7% | 40% | 414.00 | 50% | 50% | 20% | 20% | 20% | 20% | 20% | ||
| 30,288,325 | 622% | 80% | 1.40 | 36% | 64% | 20% | 20% | 21% | 20% | 19% | ||
| 13,684,718 | 53% | 21% | 1.82 | 58% | 42% | 20% | 19% | 23% | 21% | 17% | ||
| 23,629,211 | -3% | 29% | 88.80 | 96% | 4% | 23% | 14% | 10% | 36% | 17% | ||
| 15,955,566 | 4% | 1% | 2.65 | 58% | 42% | 20% | 16% | 19% | 19% | 26% | ||
| 13,982,729 | 36% | 25% | 2.10 | 44% | 56% | 22% | 19% | 19% | 22% | 18% | ||
| 13,484,769 | 0% | 20% | 2.42 | 44% | 56% | 22% | 19% | 19% | 22% | 18% | ||
| 13,362,995 | 301% | 51% | 1.58 | 36% | 64% | 19% | 21% | 21% | 20% | 19% | ||
| 13,230,137 | 382% | 40% | 0.28 | 50% | 50% | 20% | 20% | 19% | 20% | 21% | ||
| 12,964,651 | 88% | 33% | 2.07 | 50% | 50% | 20% | 20% | 20% | 20% | 20% | ||
| 12,964,651 | -10% | 54% | 2.74 | 97% | 3% | 22% | 14% | 10% | 35% | 19% | ||
| 12,065,000 | 25% | 14% | 181.00 | 50% | 50% | 20% | 20% | 20% | 20% | 20% | ||
| 11,861,035 | 97% | 36% | 2.21 | 50% | 50% | 20% | 20% | 20% | 20% | 20% | ||
| 9,960,074 | 76% | 21% | 2.95 | 67% | 33% | 19% | 19% | 16% | 28% | 19% | ||
| 8,502,524 | -20% | 3% | 1.24 | 41% | 59% | 23% | 25% | 14% | 30% | 8% | ||
| 7,411,220 | 71% | 40% | 1.44 | 64% | 37% | 17% | 19% | 26% | 27% | 11% | ||
| 6,641,209 | -6% | 24% | 43.20 | 86% | 14% | 10% | 33% | 25% | 25% | 7% | ||
| 6,130,065 | 7% | 38% | 1.97 | 82% | 18% | 23% | 17% | 14% | 28% | 18% | ||
| 5,487,925 | -26% | 14% | 71.30 | 77% | 23% | 33% | 14% | 10% | 17% | 26% | ||
| 4,344,924 | 21% | 33% | 198.00 | 50% | 50% | 20% | 20% | 20% | 20% | 20% | ||
 |
2006 Search Engine Request Keyword Trends | |
| Top Worldwide Search Requests | Top US Cities Search Requests | |
| 1. South Africa | 1. Elmhurst, IL | |
| 2. Ireland | 2. Stockton, CA | |
| 3. New Zealand | 3. Meriden, CT | |
| 4. United Kingdom | 4. Chandler, AZ | |
| 5. Australia | 5. Louisville, KY | |
| 6. Estonia | 6. Irvine, CA | |
| 7. Norway | 7. Kansas City, KS | |
| 8. Canada | 8. Norfolk, VA | |
| 9. Croatia | 9. Tampa, FL | |
| 10. Lithuania | 10. Oklahoma City, OK | |
| 1. Bolivia | 1. Elmhurst, IL | |
| 2. Chile | 2. Meriden, CT | |
| 3. Romania | 3. Oklahoma City, OK | |
| 4. Ecuador | 4. Irvine, CA | |
| 5. Pakistan | 5. Kansas City, KS | |
| 6. Peru | 6. Tampa, FL | |
| 7. Mexico | 7. Chandler, AZ | |
| 8. Slovenia | 8. Norfolk, VA | |
| 9. Lithuania | 9. Richardson, TX | |
| 10. Colombia | 10. Las Vegas, NV | |
| 1. Pakistan | 1. Elmhurst, IL | |
| 2. India | 2. Meriden, CT | |
| 3. Egypt | 3. Kansas City, KS | |
| 4. Turkey | 4. Louisville, KY | |
| 5. Algeria | 5. Southfield, MI | |
| 6. Morocco | 6. Newark, NJ | |
| 7. Indonesia | 7. Oklahoma City, OK | |
| 8. Vietnam | 8. Norfolk, VA | |
| 9. Iran | 9. Irvine, CA | |
| 10. Croatia | 10. Chandler, AZ | |
| Internet Pornography Statistics | |
| Pornographic websites | 4.2 million (12% of total websites) |
| Pornographic pages | 420 million |
| Daily pornographic search engine requests | 68 million (25% of total search engine requests) |
| Daily pornographic emails | 2.5 billion (8% of total emails) |
| Internet users who view porn | 42.7% |
| Received unwanted exposure to sexual material | 34% |
| Average daily pornographic emails/user | 4.5 per Internet user |
| Monthly Pornographic downloads (Peer-to-peer) | 1.5 billion (35% of all downloads) |
| Daily Gnutella “child pornography” requests | 116,000 |
| Websites offering illegal child pornography | 100,000 |
| Sexual solicitations of youth made in chat rooms | 89% |
| Youths who received sexual solicitation | 1 in 7 (down from 2003 stat of 1 in 3) |
| Worldwide visitors to pornographic web sites | 72 million visitors to pornography: Monthly |
| Internet Pornography Sales | $4.9 billion |
| Children Internet Pornography Statistics | |
| Average age of first Internet exposure to pornography | 11 years old |
| Largest consumer of Internet pornography | 35 – 49 age group |
| 15-17 year olds having multiple hard-core exposures | 80% |
| 8-16 year olds having viewed porn online | 90% (most while doing homework) |
| 7-17 year olds who would freely give out home address | 29% |
| 7-17 year olds who would freely give out email address | 14% |
| Children’s character names linked to thousands of porn links | 26 (Including Pokemon and Action Man) |
| Adult Internet Pornography Statistics | |
| Men admitting to accessing pornography at work | 20% |
| US adults who regularly visit Internet pornography websites | 40 million |
| Promise Keeper men who viewed pornography in last week | 53% |
| Christians who said pornography is a major problem in the home | 47% |
| Adults admitting to Internet sexual addiction | 10% |
| Breakdown of male/female visitors to pornography sites | 72% male – 28% female |
| Women and Pornography | |
| Women keeping their cyber activities secret | 70% |
| Women struggling with pornography addiction | 17% |
| Ratio of women to men favoring chat rooms | 2X |
| Percentage of visitors to adult websites who are women | 1 in 3 visitors |
| Women accessing adult websites each month | 9.4 million |
| Women admitting to accessing pornography at work | 13% |
| Women, far more than men, are likely to act out their behaviors in real life, such as having multiple partners, casual sex, or affairs. | |
| Top Video Porn Producers | Top US Erotica Important Cities | |||
| Country | Major Producers | Cities | Importance | |
| 1. United States | Vivid Entertainment, Hustler, Playboy, Wicked Pictures, Red Light District | 1. Los Angeles | Adult Production Companies | |
| 2. Brazil | Frenesi Films, Pau Brazil, MarcoStudio | 2. Las Vegas | Adult Stars, Sin City Chamber of Commerce | |
| 3. The Netherlands | Erostream, Midhold Media, Your Choice, Seventeen | 3. New York | Adult Entrepreneurs, Erotica | |
| 4. Spain | Private Media Group, Woodman Entertainment | 4. Chicago | Playboy | |
| 5. Japan | Soft on Demand, Moodyz | 5. San Francisco | Adult Websites, Adult Companies | |
| 6. Russia | Beate Uhse, SP-Company, Dolphin Entertainment | 6. Miami/South Florida | Adult Websites, Penthouse | |
| 7. Germany | Trimax, SG-Video, GGG, VideoRama, Zip Production | 7. Seattle/Pacific Northwest | Adult Websites | |
| 8. United Kingdom | Hot Rod Productions, JoyBear Pictures, Blue Juice TV, Rude Britannia, Fresh SX | 8. San Diego | Adult Websites, Strip Clubs | |
| 9. Canada | Wild Rose Productions, Eromodel Group, Dugmor | 9. Phoenix /Tucson/ Scottsdale | Club Jenna, Erotica | |
| 10. Australia | Pistol Media | 10. Hillsborough, NC. | Adam & Eve | |
| Other Notables | 11. Boulder, CO. | New Frontier | ||
| Sweden | Maxs Video | 12. Pittsburgh | DVD Sales | |
| Italy | Adamo Entertainment | 13. Portland | Strip Club | |
| Denmark | Color Climax Corporation | |||
| France | Euro Choc, Eil du Cochon, Ragtime, Video Marc Dorce, JTC Video, Colmax, Cadinot | |||
| Switzerland | Gordi Films, Ikarus | |||
| Belgium | GM Videos | Top Pornography Banning Countries | ||
| Romania | Floyd-Agency | Saudia Arabia, Iran, Syria, Bahrain, Egypt, UAE, Kuwait, Malaysia, Indonesia, Singapore, Kenya, India, Cuba, China | ||
| Portugal | Natural Video | |||
| Israel | Sex Style | |||
| Serbia | Hexor | |||
| Czech-Republic | Lupus Pictures, Bel Ami | |||
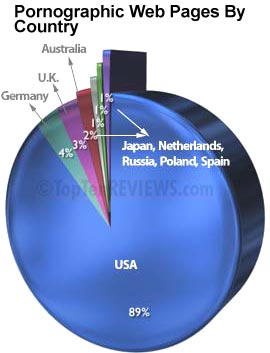 |
Country | Porn Pages |
| United States | 244,661,900 | |
| Germany | 10,030,200 | |
| United Kingdom | 8,506,800 | |
| Australia | 5,655,800 | |
| Japan | 2,700,800 | |
| The Netherlands | 1,883,800 | |
| Russia | 1,080,600 | |
| Poland | 1,049,600 | |
| Spain | 852,800 |
| US Adult Video Sales and Rentals | |||

|
Year | $$$ (Billions) | Units (Millions) |
| 1992 | $1.60 | 405 | |
| 1993 | $2.10 | 450 | |
| 1994 | $2.50 | 499 | |
| 1995 | $3.10 | 515 | |
| 1996 | $3.90 | 602 | |
| 1997 | $4.20 | 675 | |
| 1998 | $4.10 | 697 | |
| 1999 | $4.05 | 680 | |
| 2000 | $4.02 | 703 | |
| 2001 | $3.95 | 705 | |
| 2002 | $4.04 | 760 | |
| 2003 | $4.13 | 800 | |
| 2004 | $4.21 | 880 | |
| 2005 | $4.28 | 895 | |
| 2006 | $3.62 | 957 | |

| US Hardcore Pornography Titles Released | ||
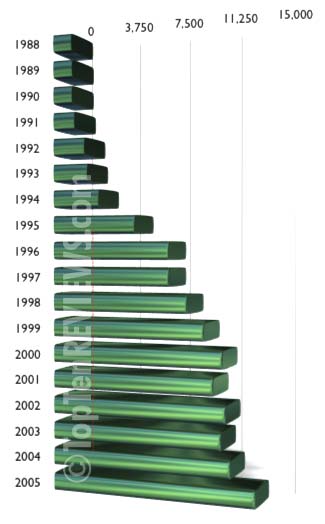 |
Year | Titles |
| 1988 | 1,300 | |
| 1989 | 1,350 | |
| 1990 | 1,340 | |
| 1991 | 1,505 | |
| 1992 | 2,200 | |
| 1993 | 2,400 | |
| 1994 | 3,200 | |
| 1995 | 5,700 | |
| 1996 | 8,000 | |
| 1997 | 8,000 | |
| 1998 | 9,200 | |
| 1999 | 10,300 | |
| 2000 | 11,500 | |
| 2001 | 10,900 | |
| 2002 | 11,700 | |
| 2003 | 11,400 | |
| 2004 | 12,000 | |
| 2005 | 13,588 | |
| US Adult Internet User Demographics – Income | ||
 |
Income | % |
| Under $15K | 6.23% | |
| $15K-$25K | 6.59% | |
| $25K-$35K | 9.55% | |
| $35K-$50K | 16.59% | |
| $50K-$75K | 25.58% | |
| $75K+ | 35.30% | |
| US Adult Internet User Demographics – Age | ||
 |
Age | % |
| 18-24 | 13.61% | |
| 25-34 | 19.90% | |
| 35-44 | 25.50% | |
| 45-54 | 20.67% | |
| 55+ | 20.32% | |
Sources:
Statistics are compiled from the credible sources mentioned. In reality, statistics are hard to ascertain and may be estimated by local and regional worldwide sources.
ABC, Associated Press, AsiaMedia, AVN, BBC, CATW, U.S. Census, Central Intelligence Agency, China Daily, Chosen.com, Comscore Media Metrix, Crimes Against Children, Eros, Forbes, Frankfurt Stock Exchange, Free Speech Coalition, Google, Harris Interactive, Hitwise, Hoover’s, Japan Inc., Japan Review, Juniper Research, Kagan Research, ICMEC, Jan LaRue, The Miami Herald, MSN, Nielsen/NetRatings, The New York Times, Nordic Institute, PhysOrg.com, PornStudies, Pravda, Sarmatian Review, SEC filings, Secure Computing Corp., SMH, TopTenREVIEWS, Trellian, WICAT, Yahoo!, XBIZ
©2003 – 2007 TopTenREVIEWS, Inc.